By Gunjan Dewan
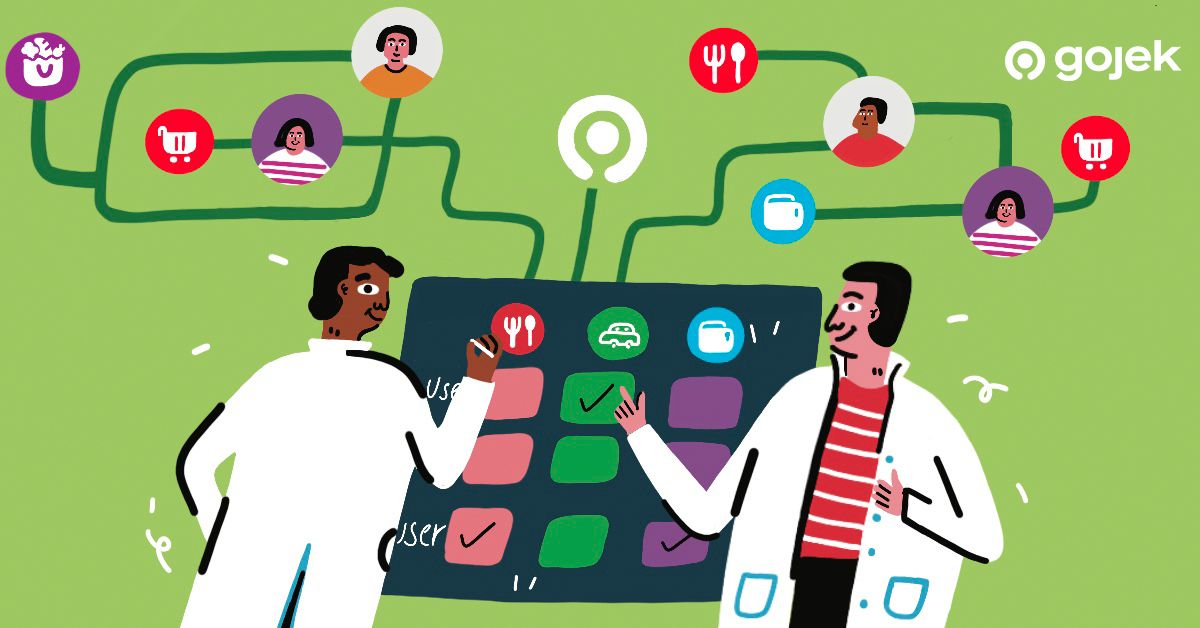
Remember how we talk about the Gojek ecosystem? The Gojek SuperApp offers over 20+ products to our users. But the important question for us is, how many people use multiple products?
Let’s assume Mike uses our two-wheeler taxi (GoRide) to commute to and from work. Perhaps on a busy day, he’d like to take our four-wheeler taxi GoCar instead? Or Indah, who religiously orders food from GoFood multiple times a week, and uses our digital payments solution GoPay to pay for them, but has never taken a ride using GoRide / GoCar, or sent a package using GoSend.
The permutations are endless, but the key point is, it makes sense for us as a business if more customers use more of the services we offer.
This is the story of how we built a matchmaking algorithm that helps us perform targeted cross-selling of Gojek services to our users to help them discover products they’ve never used. ✌
The Targeting Problem
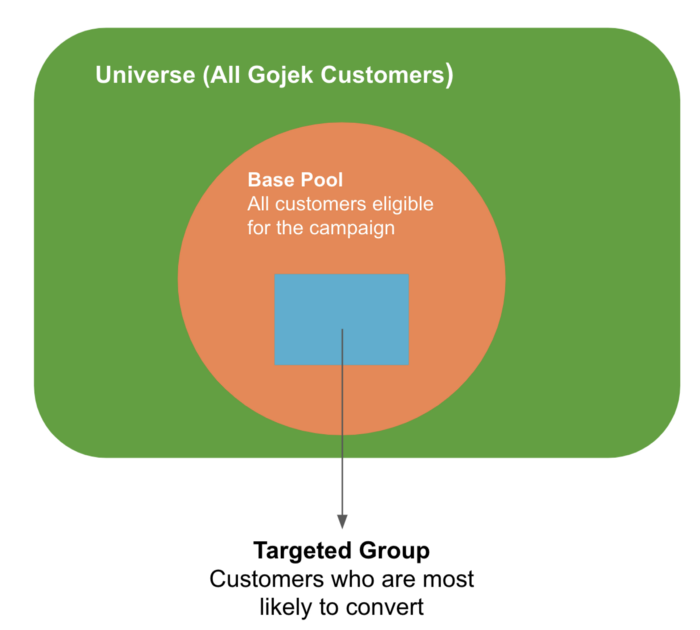
In any marketing campaign, we want to find users that will be most interested in that campaign and only send the campaign to them. This not only reduces the cost of a marketing campaign but also helps get better conversion rates! The campaigns at Gojek are no different. We want to set up campaigns for a targeted set of users so that we don’t spam our customers with campaigns that are not relevant to them.
Targeting for Cross-Sell
For a cross-sell model, the ‘base pool’ is the set of people who have never used the service in question. Example: If we want to run a campaign to acquire new GoFood users, our base pool would be of people who have used other Gojek services but have never used GoFood. So we are trying to cross-sell these users into GoFood.
Targeted Cross-Sell: Of all the users who have never used a product, find the subset that is most likely to use it when introduced to it.
A product can be a Gojek product like GoCar, GoRide, GoFood, etc. or it could be a payment method like GoPay. It could also be a product and payment type combination. Example: We want to cross-sell people into using GoFood and pay via GoPay for their orders.
Iteration 1: Classification Model
Our first hunch to solve this problem was to model this as a classification problem.
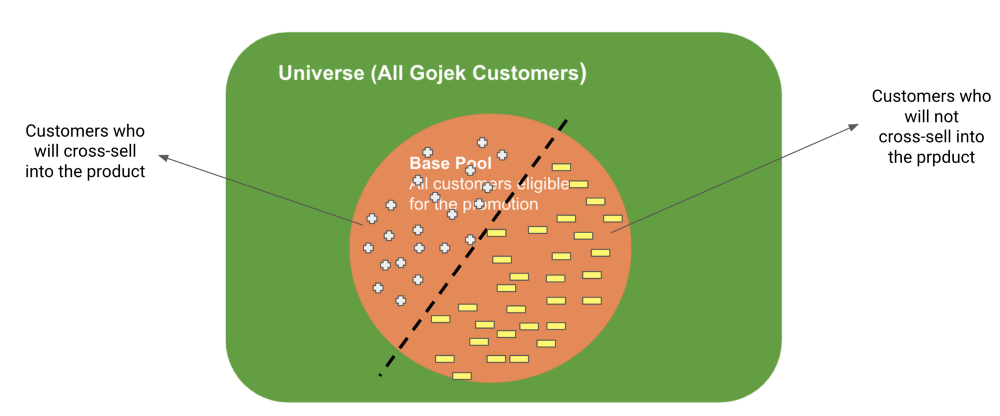
We want to classify our ‘base pool’ into 2 classes :
- Customers who will cross-sell into the product
- Customers who will not cross-sell into the product
As we expected, this model gave us very promising results. We were able to get an uplift of ~5x on the natural conversion rate of one of our key services by using this model.
However, scalability was an issue with this approach:
- We needed to train a different model for every product
- The base pool population itself will change for every product
This scalability issue pushed us to change the way we were looking at the problem all-together. We wanted an algorithm that not only improves conversion rates but also scales to different products with minimal or no effort. To do this, we redefined the problem as a match-making problem. We needed an algorithm that could match customers and products such that:
- Given a product, we get a list of people who are most likely to cross-sell into that product.
- Given a customer, we get the products that a person is most likely to transact with.
Enter, Recommendation Systems!
Iteration 2: Recommendation System
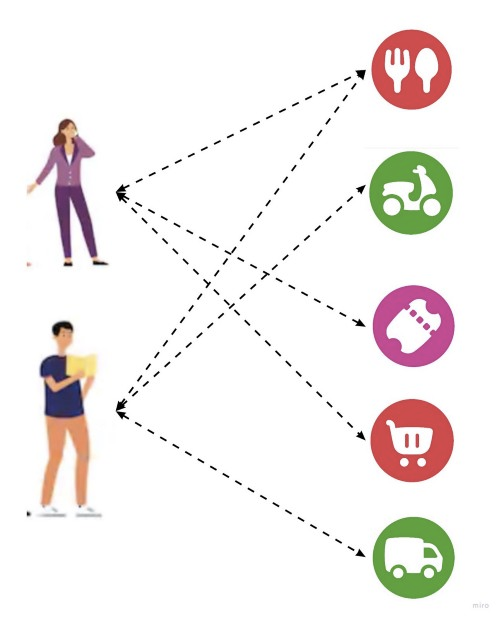
Recommendation engines use a user’s history to recommend items that a user is most likely to purchase next.
We use recommendation engines as a matchmaking mechanism between users and products/payment methods.
We treat each product/payment method as an item in the recommendation engine based on collaborative filtering.
Any recommendation engine has a utility matrix that is a map between the customers and their interactions/ratings of products. This matrix is a very sparse one as most values will be missing. In our case, products were Gojek products and the interactions were the number of times a customer uses that product.
This is what a part of our Utility Matrix would look like.
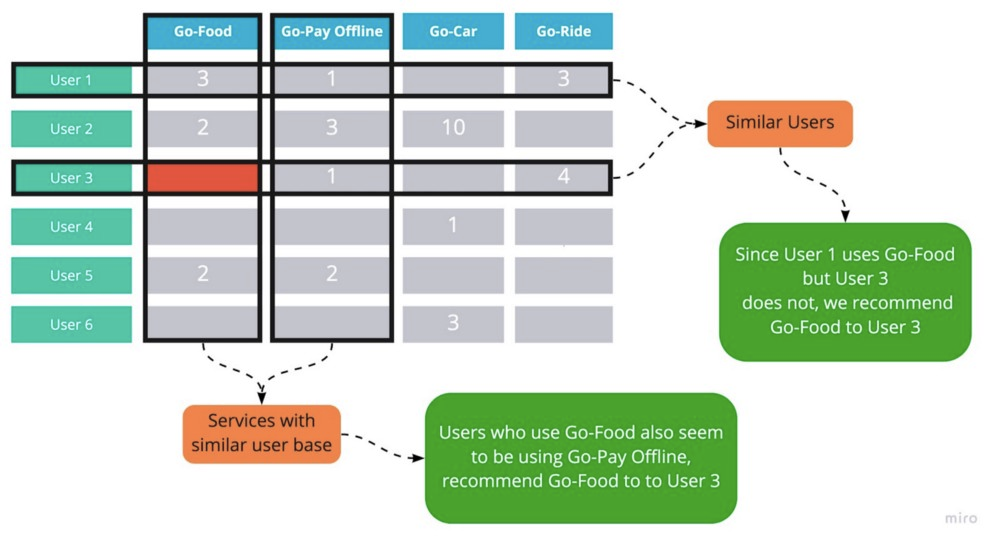
Our problem boils down to finding the values that are missing in this matrix. In the above figure, if we are able to figure out what value should go in the red cell, then we can predict the like-ness (or propensity of usage) of User 3 towards GoFood.
This approach actually gives us a list of people who are most likely to cross-sell into a given product and a list of products a customer is most likely to use.
So, how do we fill in these missing values?
We explored 2 ways to do this and I will talk about their pros and cons in the following section.
KNN
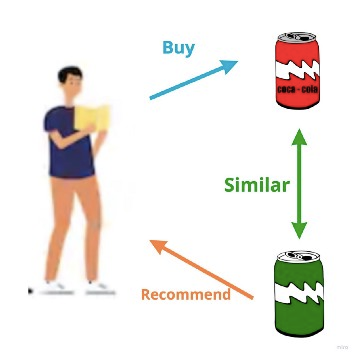
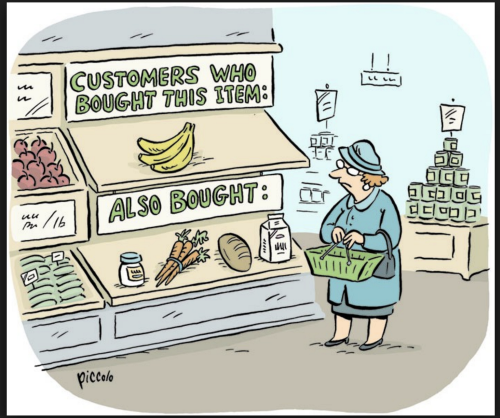
Item-Item KNN: If Tom buys a product, then we recommend Tom another product that is similar to the earlier purchase.
User-User KNN: If Tom and Kim usually buy the same items, we recommend Tom items from Kim’s purchase history and vise-versa. We are assuming that people who buy the same items are similar.
Matrix Factorization
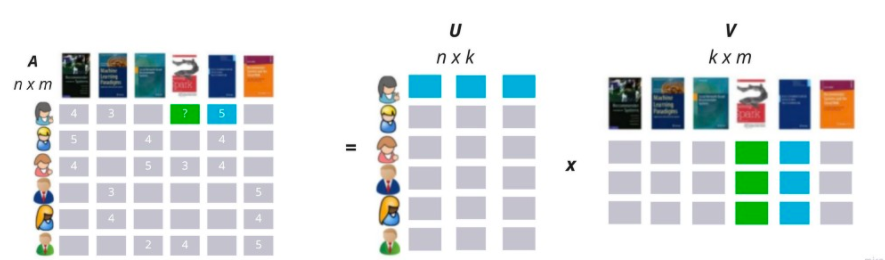
Matrix Factorization techniques try to find factors that characterize users and items. It tries to explain the ratings by characterizing both items and users on, say, 20 to 100 factors inferred from the rating patterns.
Example, while recommending for books, the discovered factors might measure dimensions such as :
- Comedy books
- Amount of romance
- Orientation to children
- Even less well-defined dimensions such as depth of character development
The green cell in the above image is filled by the dot product of the first row of matrix U and the fourth column of V. This captures the interaction between user 1 and item 4, i.e. the user’s overall interest in the item’s characteristics.
Each column in matrix U represents one such factor related to items. Each row measures the extent of interest the user has in items that are high on the corresponding factors, positive or negative.
Each row in matrix V represents one such factor related to users. Each column measures the extent to which item possesses those factors, again, positive or negative.
Pros and Cons of Each Approach
In the case of user-user KNN, we are claiming that users who use the same services are similar. This makes sense. However, this would mean storing a matrix of O(n²). This is computationally very expensive. That’s why User-User KNN does not make sense for us.
In the case of Item-Item KNN, we are saying that 2 of our products are similar or dissimilar. This is absurd. We cannot say if GoCar and GoFood are similar or not.
This is why KNN is not a good approach for our use case.
In the case of Matrix Factorisation, the Utility Matrix is decomposed into a product of two matrices, one which projects the user’s preferences into a space of “latent factors” and the other which represents which combination of these latent factors correspond to which service type. Hence, we decided to go ahead with the Matrix Factorization approach for our final model.
Some Challenges we faced
1. Size of the Utility Matrix
We have millions of active customers and 20+ different products, and when you add payment methods to this the number of products increases even further. This led to a utility matrix that was huge in size and building a recommendation engine on it became very time consuming using a single machine. We used Spark’s distributed environment to deal with the size of the matrix. This reduced the recommendation engine building time from ~6 hours to ~1 hour.
2. Explicit vs Implicit Feedback
Explicit Feedback: This is the kind of data that explicitly indicates the likes and dislikes of a user. Example: Ratings given by users at IMDb or Netflix.
Implicit Feedback: This is the kind of data that tells us which product a person has purchased or transacted with, but does not tell us whether a person likes it or not. Example: purchase history, browsing patterns, search history, etc.
Recommendation Engines are usually built on explicit feedback. What they are trying to predict is the level of like-ness a user will have for a product. What we have at Gojek is implicit feedback. We had to convert our implicit feedback into an explicit like-ness score for every user.
3. SGD vs ALS
Stochastic Gradient Descent (SGD) and Alternating Least Squares (ALS) are 2 different optimization algorithms used in the industry for matrix factorization techniques. Even though SGD is more widely used and easily available, ALS is recommended for implicit feedback in a distributed environment. It is not very trivial to implement SGD in a distributed environment, however, there are some libraries out there that implement ALS in Spark. Hence, we decided to use ALS for our use-case.
Our current workflow
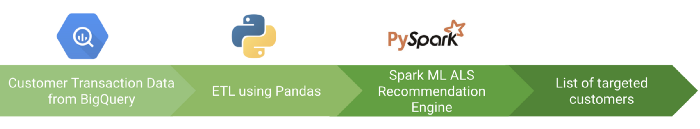
We first get our data from BigQuery.
Then we do some ETL and get our utility matrix in the desired form using pandas. Doing ETL on raw data to get a utility matrix is not a very expensive operation and pandas was working efficiently. However, building a recommendation system is an expensive job. Along with storing the utility matrix in memory, it also does optimization to get the factorized matrices. We use the Spark ML library for building the recommendation engine.
Finally, we get a list of customers to target along with their probability score!
Field Tests
Once we have a model ready, how do we know how well it will work in the real world? For this, we created a field test.
This is what our experiment design looks like:
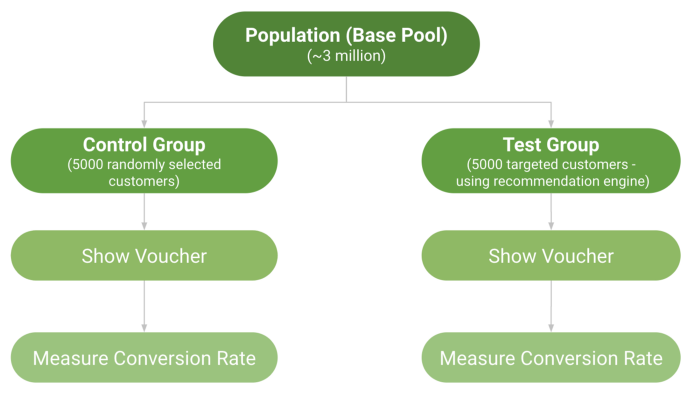
The test group is the set of users our algorithm has predicted will convert and the control group is a randomly selected set of users.
Our hypothesis here is that :
Conversion Rate (Test) >> Conversion Rate (Control)
If this above condition is true, then we can assume that our model is doing well in the real world. If it’s not true, then we need to go back to the drawing board and re-evaluate the model and the data we are using.
For us, our field test results were great and we got an uplift between 5x to 7x across service types.
This post was an attempt to break down how we make data-driven decisions at Gojek, and how this works in a real-world scenario.

