
By Dinesh C
A few years ago, when Gojek was scaling internationally, at the forefront of the expansion was our consumer app used by millions of people across Southeast Asia. Needless to say, our engineering team was growing too, and we rapidly increased from 40 to 140+ Android and iOS engineers — all working on the #SuperApp.
Every line of code committed has to go through unit tests, code quality checks, regression tests and other routines to maintain high quality code… You know the drill.
A little bit of background, for the uninitiated
The moment a commit is pushed to the remote branch, a pipeline is triggered in the CI. The pipeline staunchly does the job of running a wide array of quality checks and runs for ~45-50 minutes (test: ~10min, build ~20 min, static analysis ~15min). Some engineers are very meticulous and commit granularly. With nearly 10-20 commits and an average of 300 minutes of pipelines run every day, per developer.
We had 140+ engineers.
An average of ~1100 pipelines per day.
Amounting to ~550 hours of pipeline duration each day.
This is the story of how the Developer Experience (devX) team has been tackling this huge load.
Why is CI important to us?
- Engineers code confidently knowing what they write wouldn’t break other parts of the system
- Development teams confidently ship faster
- Provides early feedback to engineers
- Ensures better collaboration between engineers and Quality Analysts
- Product managers get builds(Nightly, Alpha, Beta) to see their features
- Designers can smoothly run periodic compliance checks of the design standards
- For early feedback on features, the CI system is expected to distribute builds as easily as possible
The challenges
The CI pipeline impacts across the org wide and deep, and with hundreds of engineers working towards a common goal, the challenges we face on the mobile infra are unique.
- Availability of runners
- Duration of pipelines
- Feedback cycles
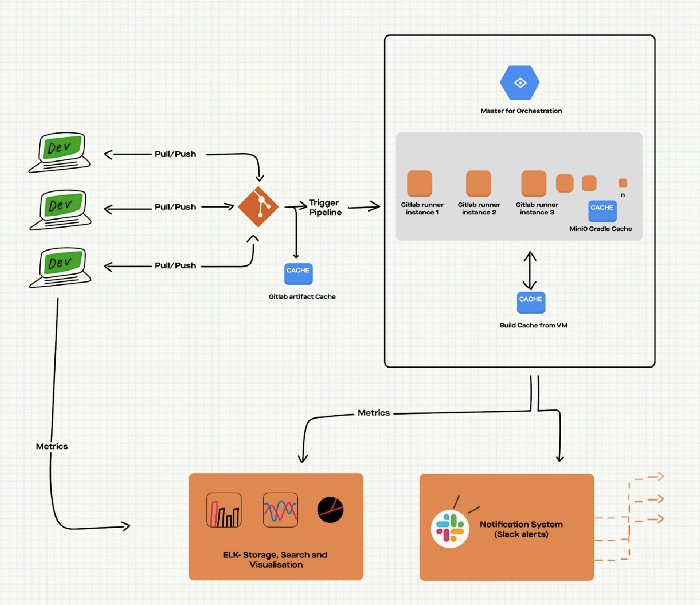
Before we delve into how we go about tackling challenges, what’s a runner, you ask?
Gitlab Runner is an open source project used to run jobs and send the results back to GitLab. It is used in conjunction with GitLab CI/CD, the open-source continuous integration service included with GitLab which coordinates the jobs.
Let’s understand what runner availability means, to know the gravity of the situation. Imagine a software engineer commits a block of code to a remote repository and this change needs to be run through a pipeline to do a few validations. The pipeline needs a machine to run on and there are runners we have kept ready.
Ideally, the idea is to have a few runners and run the pipeline on one of them. But what if there are several developers pushing code during peak work hours? Probably 20 of them simultaneously or in quick succession. We’ve had days with more than 250 commits to the master branch and we don’t have an infinite number of runner machines available with us. This means some of the developers have to wait for a while until their code change can be run through pipelines.
Waiting is not cool. The challenge at hand is to not let developers wait for a long time. The faster developers get feedback on their code change, the better.
Tackling these challenges
⚙️ The tech
- Gitlab yml [For configuration]
- Kubernetes [ For infrastructure and orchestration ]
- Docker Images [For a reproducible build environment]
- Elastic search + Kibana [ For analysis and visualization ]
- Ruby [ Scripting for CI ]
- MinIO for gradle cache
- Slack bots [ For proactive feedback to developers ]
- Helm [For deployments on kubernetes]
The techniques
- Measure
- Segregate
- Parallelise
Segregation of pipelines
- Categorising pipelines
- Categorising jobs based on functionality
- Categorising jobs based on infra needed
Categorising pipelines
For running 550 hours of pipelines every day, we could have provisioned ~22 machines with 20–30 GB RAM and 8 cores each. But, this unoptimised approach means
- High cost
- Low availability (Only 22 jobs can be run at any point of time and the rest would have to wait)
- Under-utilisation of resources (A job with 20 GB RAM and a job with just 500mb of RAM would run on machines with 30 GB RAM, which is not optimal)
Examples of pipeline categories
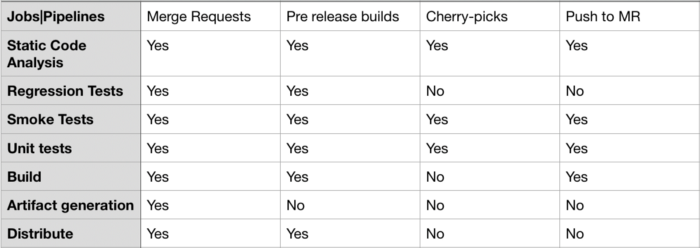
These examples indicate that different pipelines/jobs have different functional and infrastructure requirements. Categorising pipelines allows better infrastructure planning.
Here’s how we plan for such differences:
- Each pipeline is divided into different stages
- Each stage is divided into small jobs
That being said, the smallest unit of a CI Pipeline is a ‘job’ and it needs an environment to run. It is as this point that the infrastructure needs to be planned. There are a few variables that can help us to determine the infrastructure needs of a job.
Variables of a job
- Runtime Environment
- Memory requirements
Example 1:
A job that executes a Ruby script would require
- A ruby docker container to be loaded
- A gigabyte of RAM, and probably 1 core of CPU
- Hence we would need a machine with a GB of RAM and one core CPU
Example 2:
A job that needs to sync code from repository and build an APK would need
- A linux docker container with Android SDK, Gradle, and Git installed
- At least 16 GB of RAM for building a decent sized Android App + memory for docker and Gradle daemon
- At the least 2–4 cores of CPU to speed up builds
How do we segregate?
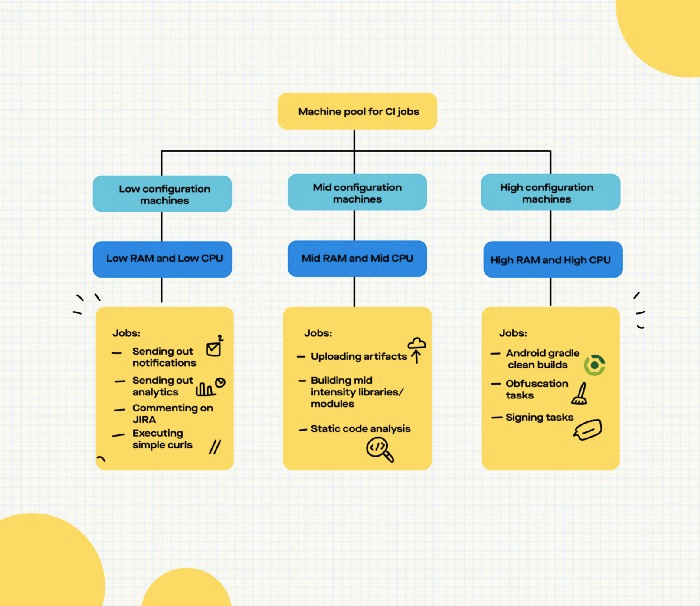
- Low config machines [ 2 GB RAM, 2 Core CPU]
→ For jobs that do not involve GIT
→ For jobs that do not involve Gradle
→ For jobs that involve only running small scripts (Typically for data collection and executing curl commands)
- Mid config machines [ 8+ GB RAM, 2+ cores ]
→ For publishing artefacts
→ For jobs involving GIT
- High config machines [ 25+ GB RAM, 4+ Cores ]
→ For compiling and building code
→ For jobs involving Gradle daemons
→ For jobs involving GIT
Each job in the CI falls into one of the following categories.
Hence, each job that we define in .gitlab-ci.yml would have a tag for indicating the jobs infra category.
For example, a Gitlab template for jobs executing only a ruby script may look like this
.ruby_job_template: &ruby_job_template
<<: *job_template
image: ruby:2.7.0
tags:
- low-config
Measure
Faster feedback is directly proportional to developer experience.
Variables contributing to this are:
- Waiting time: The moment a developer submits a Merge Request, if the pipelines start immediately, the developer is happy. If the developer keeps seeing “Waiting for pipeline to start”, that’s a bad thing especially if this is for more than a few minutes.
- Completion time: A pipeline taking hours to complete is obviously irritating.
Now that we have the infra provisioned and the entire CI up and running, there are a myriad of things that can go wrong because we are dealing with a lot of different variables and the code is continuously changing.
In order to proactively adapt the CI with the changing code characteristics, we need to be one step ahead. That’s where we need to monitor, measure and react.
Our measuring and monitoring framework of choice was ELK.
What do we measure?
There are 2 category of things we measure
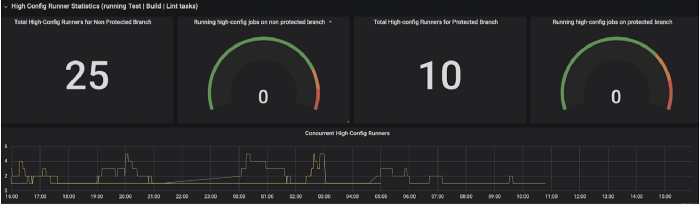
Infrastructure and pipeline statistics (to help the Devops team)
- Time taken by each job to run
- Time taken by each pipeline to complete
- Frequency of pipeline failure
- Availability of infrastructure at any moment
- Average waiting time for each job
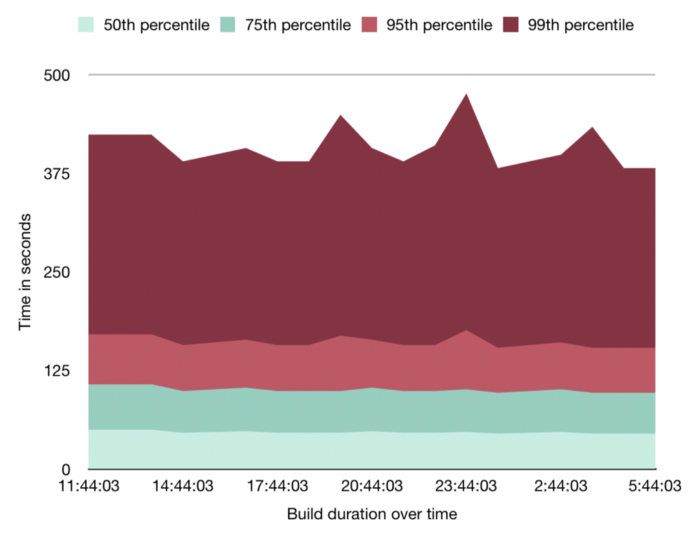
- Build time of apps over time
- Execution times of different Gradle tasks over time
- Development environment settings of dev machines
Code statistics (to help the developers)
- Code smells over time
- Code coverage per module over time
- Apk size over time
- Number of warnings on lint over time
These extensive measurements allow us to take action proactively.
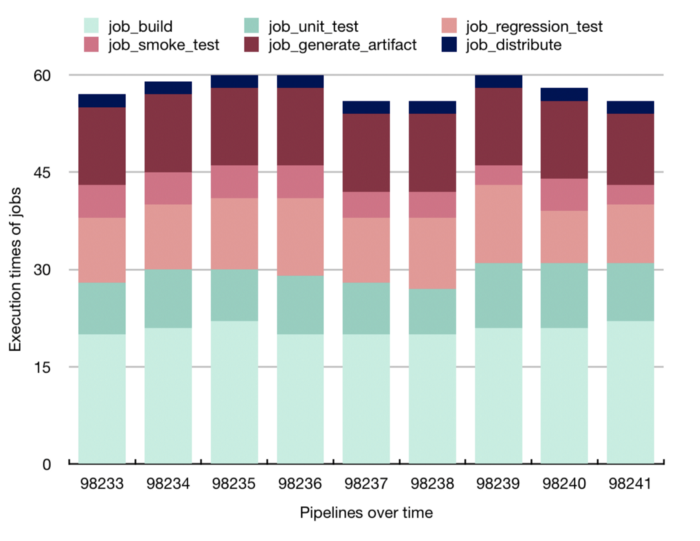
How do we measure?
We need to keep the measuring simple and not overload the infrastructure due to measurement. Hence, all the metrics that we collect over the pipeline are transmitted through a Curl Http to an Elastic data store.
Here are a few visualisations that the team often uses:
Parallelise
If jobs are independent of each other, running them parallely can directly contribute to reduction in pipeline times. The Gitlab runner configuration file allows us to define how many jobs can be run in parallel in each runner.
Also, leveraging auto scale capabilities of Kubernetes to provision nodes will handle the peak loads coming during days preceding releases.
Completing the feedback loop
Developers need to be made aware of the status of merge requests. Events like pipeline start, pipeline completion, pipeline success, pipeline failures are conveyed to MR authors via slack bots that are integrated into the CI system.

Optimising the duration of pipelines
Better Caching in CI is crucial for improving pipeline times. However, this topic is big enough and deserves a separate blog altogether.
Some ways of optimising the duration of pipelines are:
- Failing fast
- Fine-tuning Gradle properties for faster builds
- Reducing the amount of network requests done from the CI
- Lean installation (Install only ruby/android sdk binaries and not docs)
What are we up to?
We have come a long way on building a reliable CI system. The next phase would be to package the CI system as a plug-and-play software and probably make it open source. We have miles to go and we are continuously improving, learning, and evolving.
How are you solving CI at scale? Do share with us your learnings, we’d be glad to hear about them.
The team that makes all this possible
Satyarth is the Architect for the devX (Developer Experience) team. He loves meddling with Gradle and calls himself a Gradle activist.
Prashanth is the iOS Engineering Manager and sets the entire infrastructure for running iOS app pipelines.
Shailesh is a script master and designs workflows to get the maximum output in minimum time. He sees the build pipeline as an assembly line.
Prathyush is a Software Development Engineer in the devX team. Kubernetes and infra excite him.
Sanju works on the tooling and infrastructure for the iOS app. He is always interested in automating dev workflows.
Asif works on the build tools for iOS that includes optimising for XCode and the project structure.
Avadhut works on the tooling around iOS to enhance developer productivity.
Dinesh is the Engineering Manager for devX (Tooling, Infra and Build System).
Stay tuned for more on the Devops series. CI for iOS, optimising Gradle caching for faster builds are in the writing room!

